Tamil Nadu voters were promised welfare-driven governance in 2021. Monthly schemes were projected as economic relief and social justice in action. However, fiscal data tells a more complex and uncomfortable story.
Between 2020–21 and 2025–26, the state’s own revenue collections more than doubled. This increase did not occur through a single headline-grabbing tax decision. It happened gradually, through structural revenue expansion.
The Core Fiscal Comparison
The most important numbers come from official budget analysis published by PRS Legislative Research. These figures represent what Tamil Nadu itself collected, excluding central transfers.
State’s Own Revenue Growth
| Year | Own Tax Revenue (₹ Cr) | Own Non-Tax Revenue (₹ Cr) | Total Own Revenue (₹ Cr) | % Increase from 2020–21 |
|---|---|---|---|---|
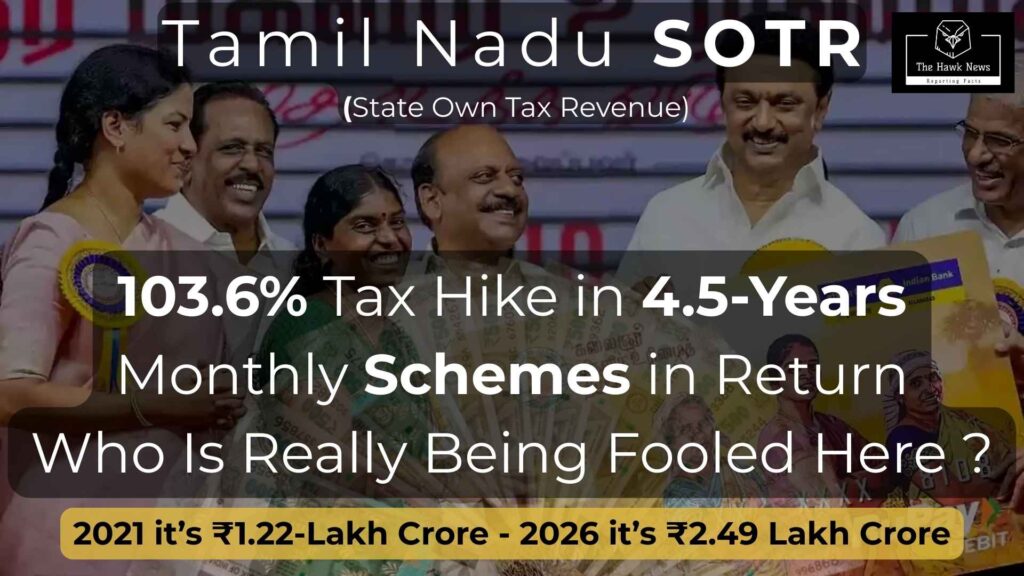
| 2020–21 (RE) | 1,09,969 | 12,683 | 1,22,652 | Base Year |
| 2025–26 (BE) | 2,20,895 | 28,819 | 2,49,714 | +103.6% |
The increase amounts to ₹1,27,062 crore in roughly 4.5 years. This reflects an annualised growth rate of approximately 17.9 percent.
Such a sustained rise signals aggressive revenue expansion rather than organic economic growth alone.
Where the Increase Happened
The rise is not limited to one category. Both tax and non-tax revenue saw substantial growth.
Category-Wise Growth
| Category | 2020–21 (₹ Cr) | 2025–26 (₹ Cr) | Absolute Increase | Percentage Growth |
|---|---|---|---|---|
| Own Tax Revenue | 1,09,969 | 2,20,895 | +1,10,926 | +100.9% |
| Own Non-Tax Revenue | 12,683 | 28,819 | +16,136 | +127.2% |
Tax collections effectively doubled. Non-tax revenue rose even faster.
This indicates not only higher taxation but also expanded administrative monetisation.
What This Means for Citizens
State’s Own Tax Revenue includes GST, excise, stamp duty, vehicle taxes, and other levies paid directly or indirectly by citizens and businesses. These are embedded in everyday transactions.
State’s Own Non-Tax Revenue includes registration fees, penalties, royalties, service fees, and interest receipts. These are collected whenever citizens interact with government systems.
Together, these two streams represent direct extraction from Tamil Nadu’s economy.
The Welfare Narrative
During this same period, the ruling Dravida Munnetra Kazhagam government under M. K. Stalin expanded visible welfare programs. Monthly financial assistance and subsidies were projected as pro-people initiatives.
However, these schemes are financed through the same revenue streams that doubled. Citizens fund the system first, and redistribution follows later.
This creates a fiscal cycle where extraction precedes welfare branding.
Structural Implications
A 103.6 percent increase in 4.5 years means revenue collections grew at nearly 18 percent annually. That pace exceeds ordinary income growth for most households.
When government collections grow faster than household incomes, the effective fiscal pressure rises. This dynamic is rarely debated publicly.
Instead, the political focus remains on visible benefits rather than invisible burdens.
Non-Tax Revenue Expansion
The 127.2 percent increase in non-tax revenue is particularly significant. It shows that administrative systems were increasingly used as revenue-generating mechanisms.
Permits, registrations, and departmental services became larger contributors. This reflects systematic monetisation of public interfaces.
Such growth suggests governance designed around revenue optimisation.
Revenue vs Redistribution
Between 2020–21 and 2025–26, Tamil Nadu collected an additional ₹1.27 lakh crore. Welfare schemes distribute a portion of this amount back to selected groups.
The critical question is how much of the total increase directly strengthened infrastructure, education, and public health. The remaining allocation patterns deserve closer scrutiny.
Without transparency, redistribution risks becoming political strategy rather than economic reform.
The Political Economy Question
When collections double within a single term, citizens must evaluate whether this reflects economic expansion or intensified extraction. Growth in revenue alone does not prove prosperity.
If people are paying significantly more while being told they are beneficiaries, the narrative requires examination.
Fiscal accountability demands that revenue growth be matched with measurable structural improvement.
The Question Before 2026
If the state collected 103.6 percent more in 4.5 years, why is giving back a portion presented as generosity? Where did the remaining ₹1.27 lakh crore go?
How much reduced debt, improved hospitals, upgraded schools, or strengthened employment capacity? These are financial questions, not political slogans.
They deserve data-backed answers before the next electoral cycle.
Conclusion
Between 2021 and 2026, Tamil Nadu’s revenue system expanded aggressively. Collections from citizens more than doubled through combined tax and non-tax channels.
At the same time, welfare schemes were amplified as visible achievements. The fiscal structure shows a circular pattern of extraction and redistribution.
Whether this model represents social justice or strategic revenue recycling is a question voters must decide with full awareness of the numbers.